The Iris Dataset, frequently used in statistics, It is ideal for learning about exploratory data analysis (EDA) an R. This set contains measurements of the characteristics of Iris flowers of three different species. Hoy, We will immerse ourselves in this flowery world to discover patterns and relationships using R.
1. First Look at the Data: First, we load the data set:
>data(iris)
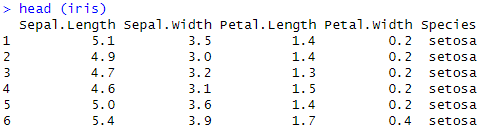
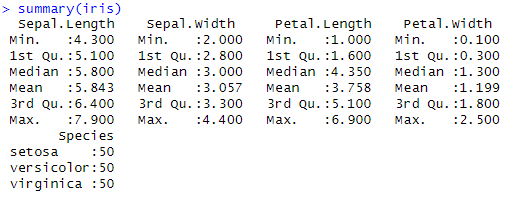
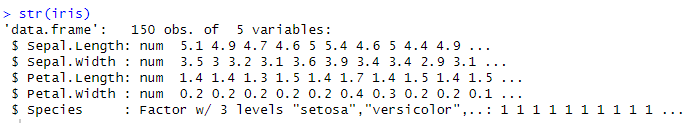
We use summary(iris) Y str(iris) to get an overview of the data, including measurements of length and width of sepals and petals, as well as the species of the flower.
library(ggplot2)
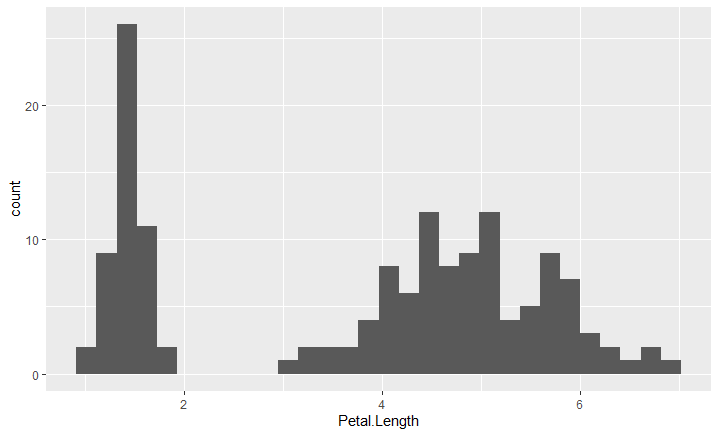
ggplot(iris, aes(x = Sepal.Length)) + geom_histogram(bins = 30)2. Basic visualization with ggplot2: We create histograms for each feature, which allows us to see the distribution of these measures:
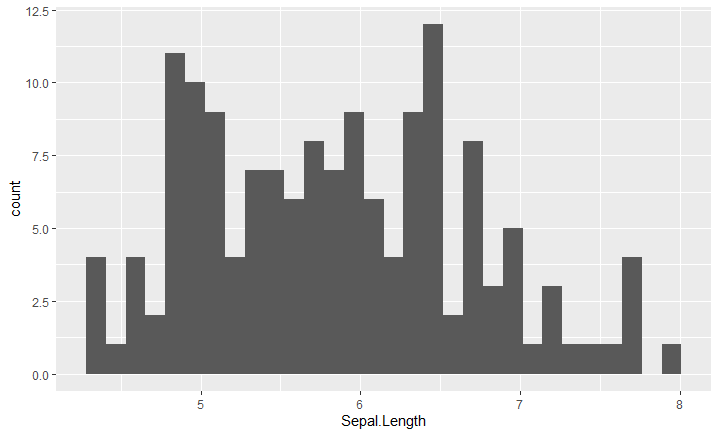
We repeat this to Sepal.Width, Petal.Length, Y Petal.Width.
> ggplot(iris, aes(x = Sepal.Width)) + geom_histogram(bins = 30)> ggplot(iris, aes(x = Petal.Width)) + geom_histogram(bins = 30)
> ggplot(iris, aes(x = Petal.Length)) + geom_histogram(bins = 30)
3. Relationship Exploration: Now, We examine how these characteristics relate to each other.. A scatter plot is perfect for this:
ggplot(iris, aes(x = Sepal.Length, y = Petal.Length, color = Species)) + geom_point()
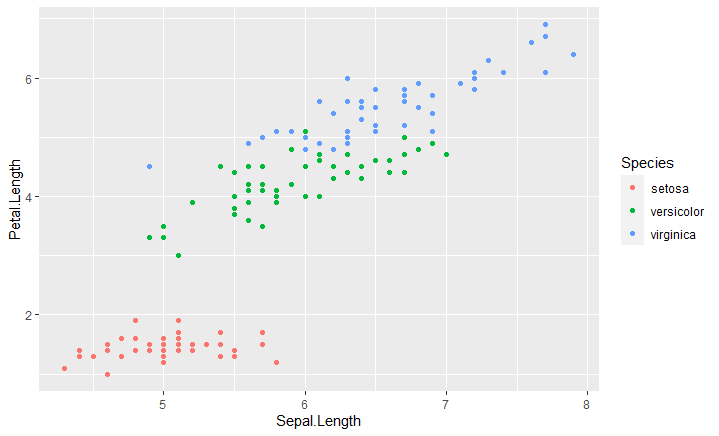
This shows us how different species differ in terms of sepal and petal length..
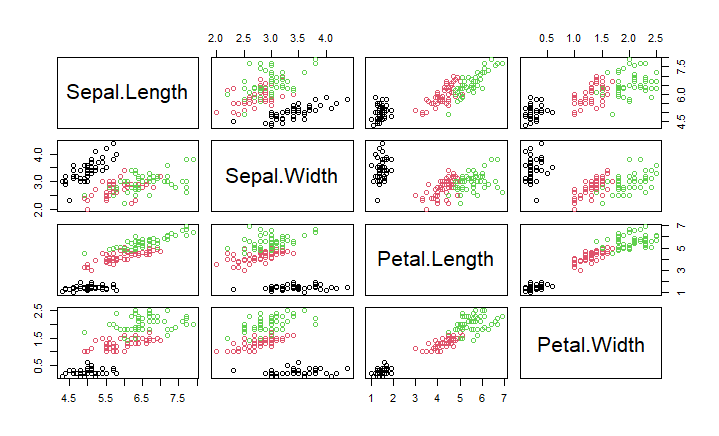
4. Multivariate analysis: We use pair graphs to see all possible relationships at once:
pairs(~Sepal.Length + Sepal.Width + Petal.Length + Petal.Width, data = iris, col = iris$Species)
5. Conclusions: This analysis reveals how the measurements of Iris flowers vary between species and gives us an idea of the usefulness of EDA in R. We've seen how R's visual and statistical tools allow us to explore and understand complex data sets intuitively..