The ggplot2 graphics package lets you define efficiently, elegant and simple.
Compared with other graphics, ggplot2 is more detailed for simple graphics, but it is less detailed for complex graphics or custom. One thing to keep in mind it is that data must always be in a file data.frame.
The ggplot package uses a different system to add weft elements. An example of using this powerful package graphic.
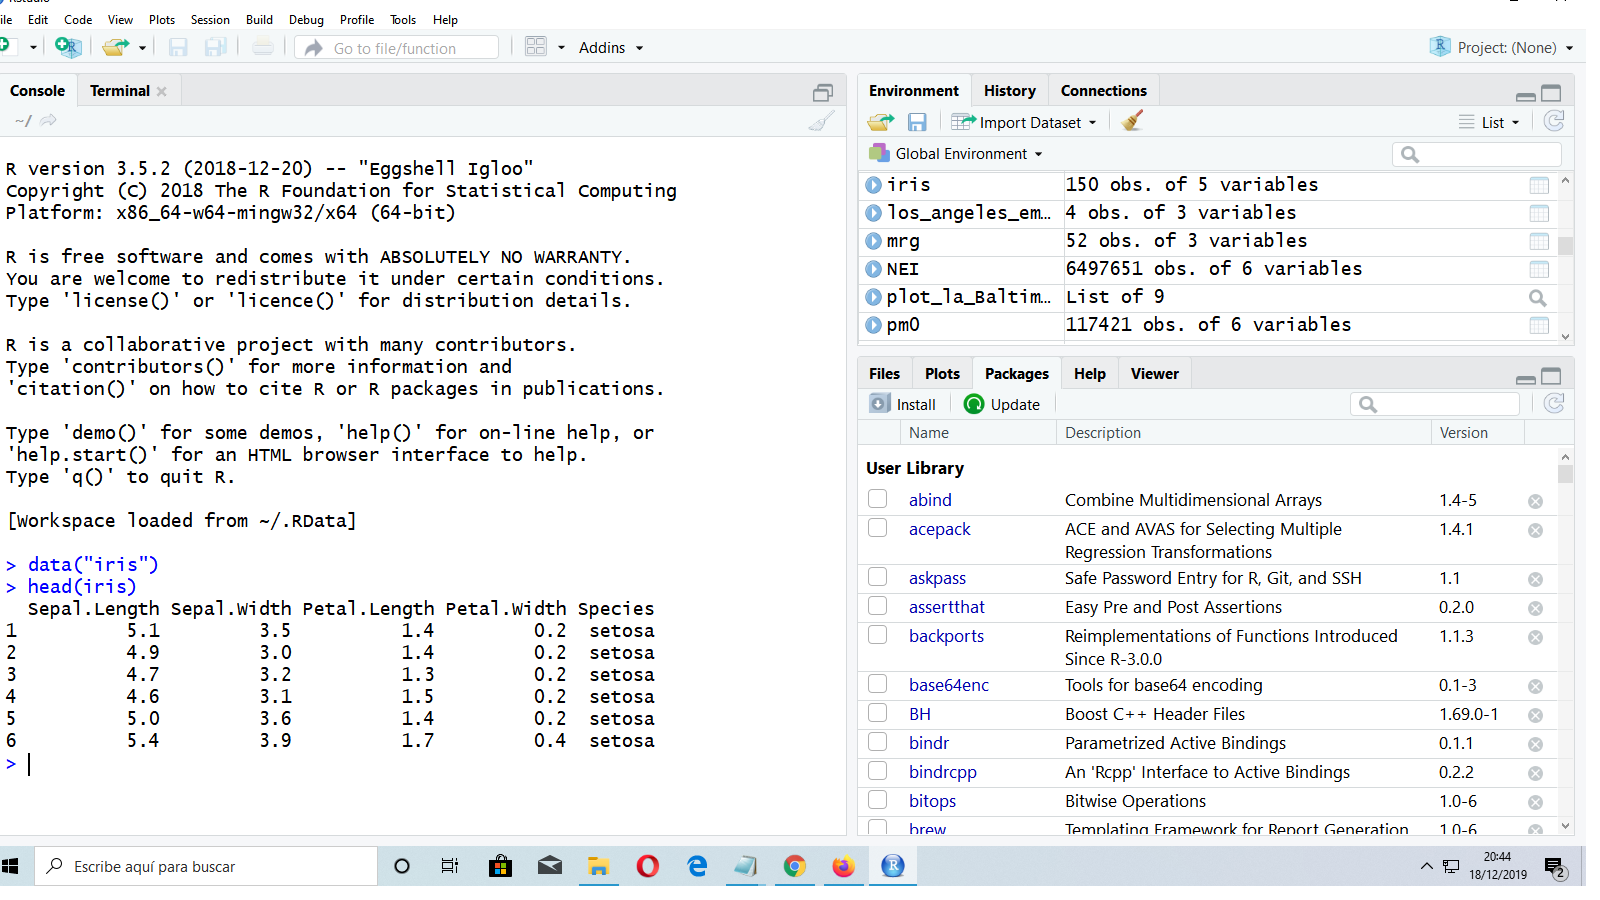
Let's compare graphs of the basic package of R and graphics of the package ggplot2. Use data from the dataset iris package that measures appear wide and long and petal sepal 3 different species of lilies.
Now we will compare a histogram made with the Base package formulas with another made with ggplot2 formulas.
With the Base package:
hist(iris$Sepal.Length)

Con ggplot2:
> library(ggplot2)
> qplot( Sepal.Length, data = iris)
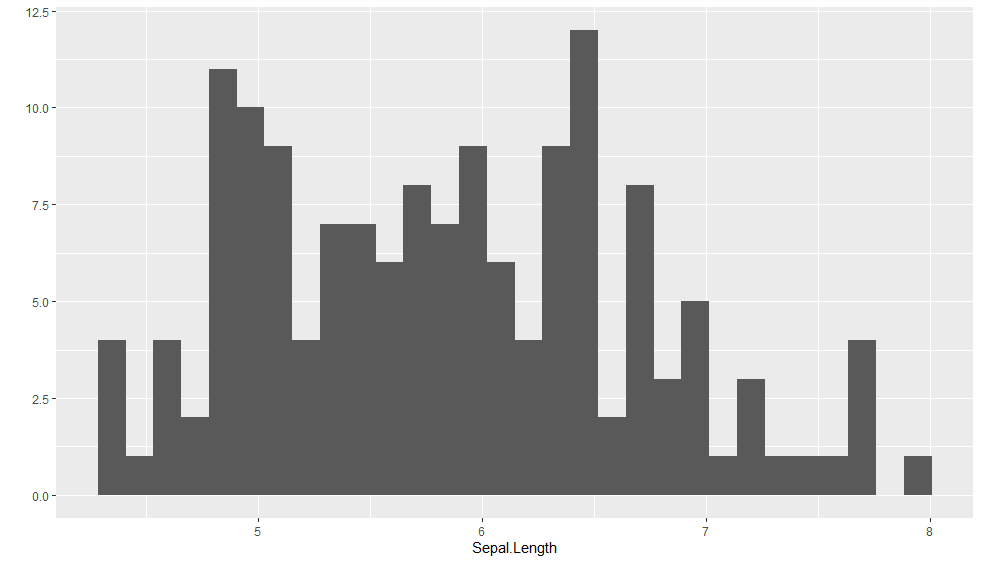
In the next entry we will talk about the command used (qplot).
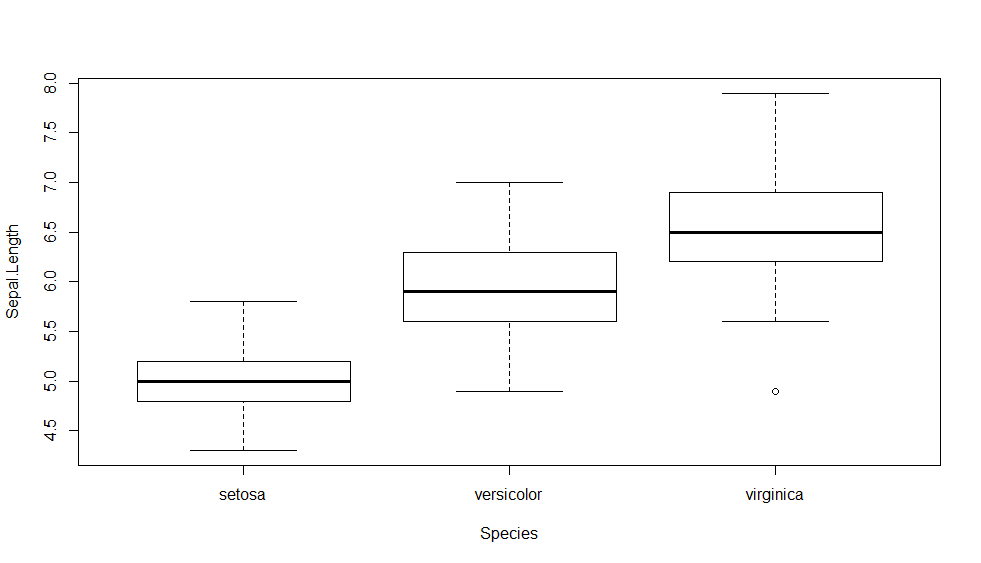
Below a “mustache box” (boxplot) with base package:
> Species<-as.factor(iris$Species) We convert the variable Species to the factor type, to be able to divide the length of the sepal by species.
> boxplot(iris$Sepal.Length ̃Species,ylab =”Sepal.Length”)
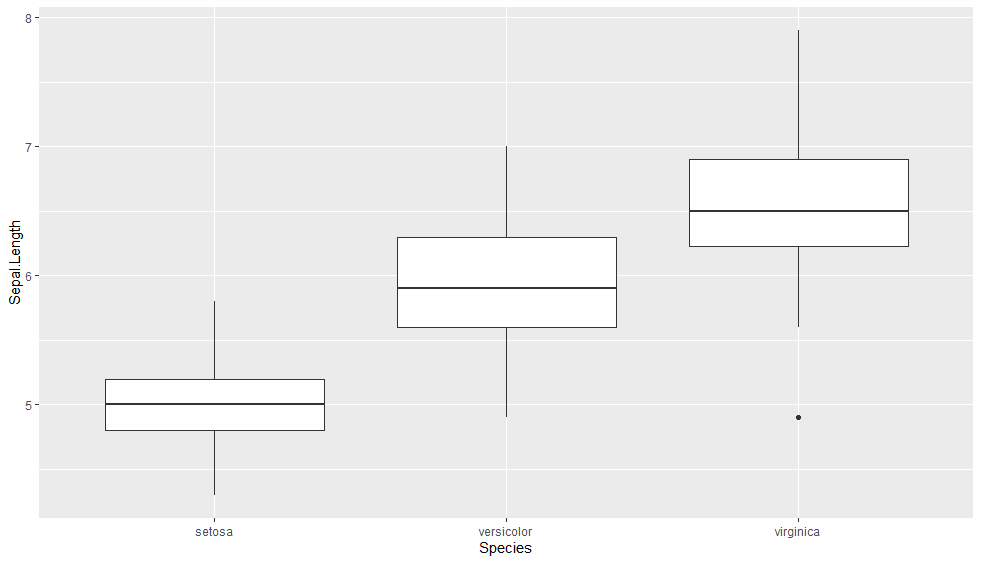
Now we will make the same graph with the ggplot2 library:
qplot(Species, Sepal.Length, data = iris, geom=”boxplot”)