R is widely used for the generation of statistical quality graphics. The graphics packages are most frequently used graphics R, grDevices (make the graphics system Base), Lattice and Ggplot2.
based graphics system
It is based on the use of packages:
- graphic graphics.Funciones hist() plot(), etc.
- grDevices.Funciones graphics devices pdf() png() ,etc.
Features:
- Model palette artist
- Create graphic canvas
- elements are added using functions, for example points()
- very intuitive
- It does not have a standard graphical language
- Calls several functions, leading to extensive codes.
- Once started the graph is not possible to return to top
- It allows initially set layouts (margins,spaces,etc) through the even function ().
graphics devices in the base system
A graphic device is the "place" where we display the graphic, and can be:
- A computer window
- Unix / Linux is released with x11()
- Windows is launched with windows()
- Mac is released with quartz()
- A PDF file
- A PNG file or JPEG
- etc.
To close the current viewport write:dev.off()
To close any viewport, although not the actual write:dev.off(número de ventana)
In case there are multiple viewports, We can switch between them using
the command dev.set(). An example:
> windows() # Create a graphic window (device 2)
> windows() # Create another graphic window (device 3): this is now the
active window
> dev.set(2) # It makes the active window Two.
When we make a chart, we must consider what we will use the chart to determine which graphics device should send. The most common place is send a graphic to a window and this is the default that sends R If not indicated otherwise.
The list of available graphical devices R It is obtained by running the command ?device.
We can see a good set of examples of graphics demo(graphics).
The command plot() It is one of the most used for gráficos.Si write plot(x, Y) where x and y are vectors with n coordinates, then R represents the scatterplot with coordinate points (xi, yi)
The main command to generate a graph R is plot().
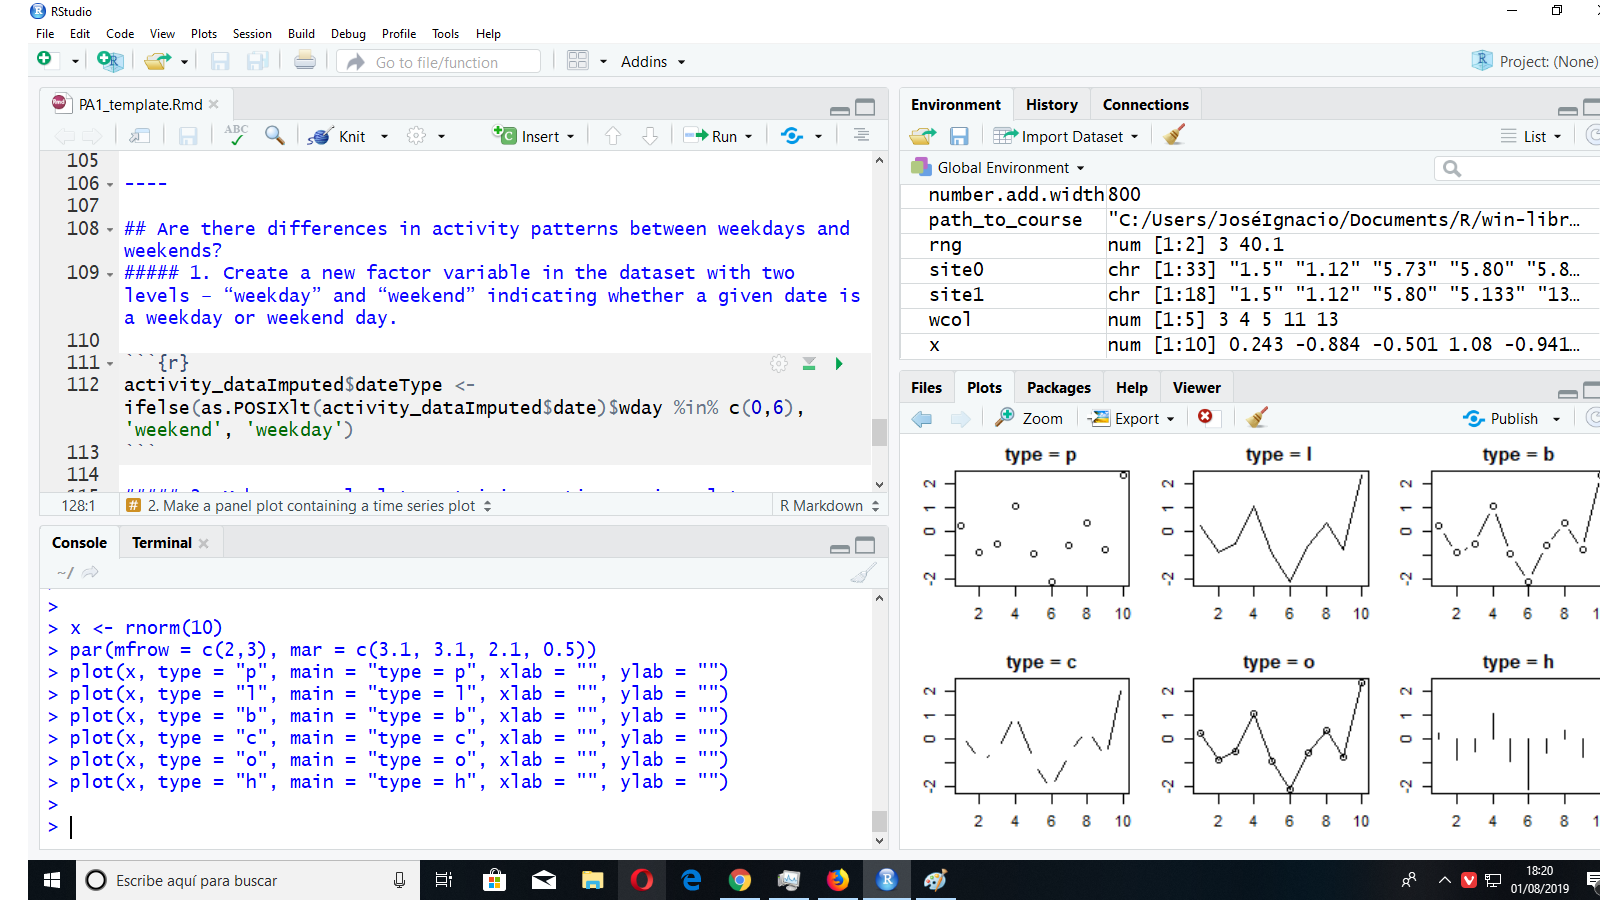
We will generate a random vector of dimension 10 and graphically represent. One of the most useful arguments is type whose parameters can be: p for points, l for lines, … (?plot). Let's see the code.
x <- rnorm(10)
par(mfrow = c(2,3), mar = c(3.1, 3.1, 2.1, 0.5))
plot(x, type = "p", main = "type = p", xlab = "", ylab = "")
plot(x, type = "l", main = "type = l", xlab = "", ylab = "")
plot(x, type = "b", main = "type = b", xlab = "", ylab = "")
plot(x, type = "c", main = "type = c", xlab = "", ylab = "")
plot(x, type = "o", main = "type = o", xlab = "", ylab = "")
plot(x, type = "h", main = "type = h", xlab = "", ylab = "")
The function par is the set of graphics parameters. Plot functions of objects generated in R will pass their arguments to the function par.
The command mfrowindicates the number of rows and columns to organize data.
The argument maris an argument to which is assigned a numeric vector with 4 values , defining the size of the 4 margins of the chart window. Por defecto mar=c(5,4,4,2)+ .1