Group items by shapes
Using conventional ggplot2 syntax, and continuing with the iris dataset, we can make graphics by grouping elements by shapes and also add lines and anti-aliasing bands, with the geom_smooth parameter.
For example:
ggplot(data=iris, aes(Sepal.Length, Petal.Length,shape=Species)) +geom_point() +stat_smooth(). # Notice that when using ggplot instead of qplot, the container must be set using the aes parameter()
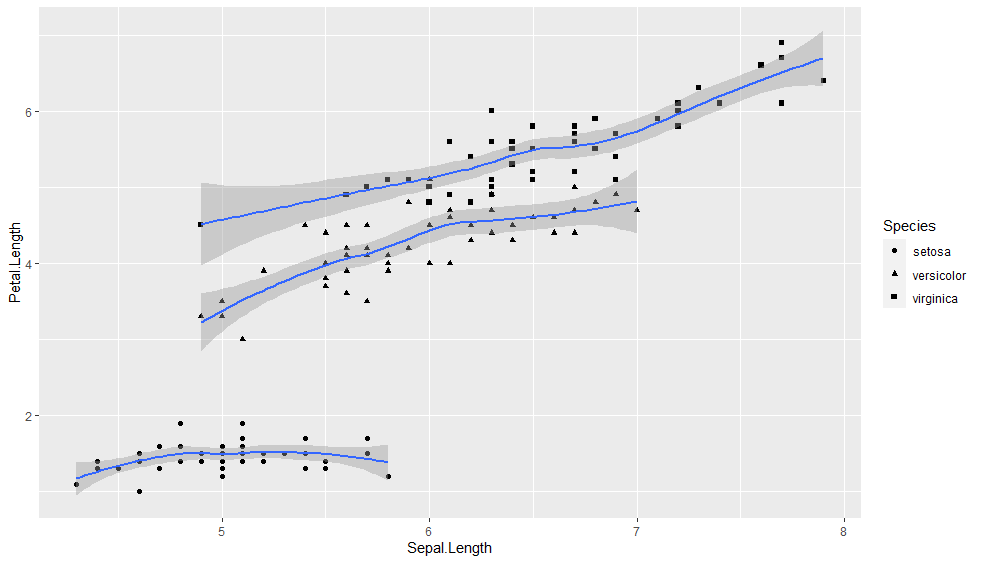
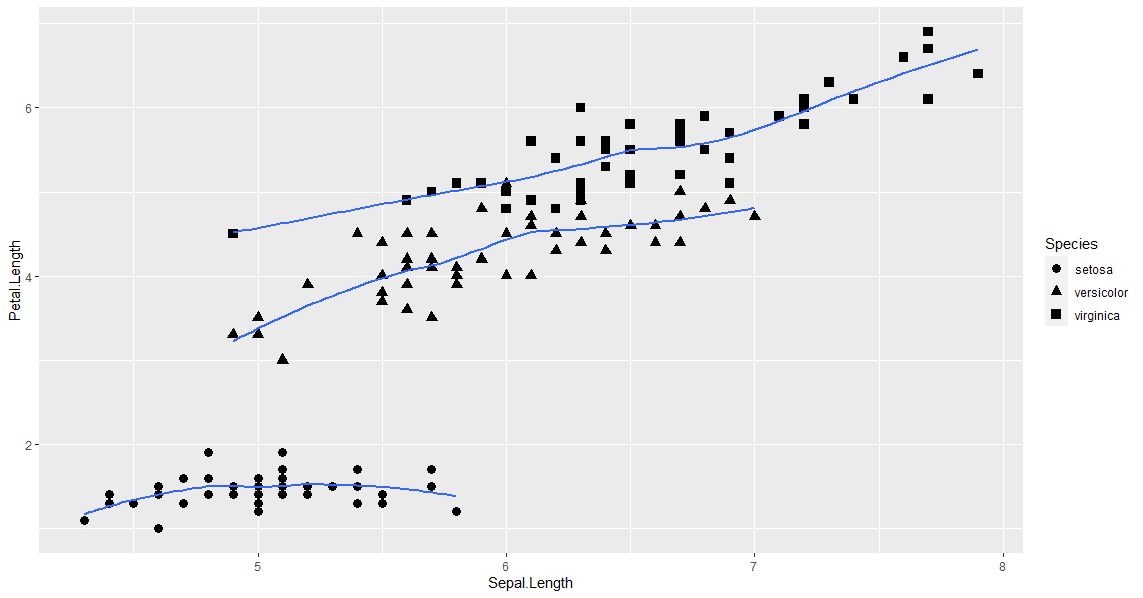
If we want to change the size, we can use “size =” inside “geom_point()"To make it more visible. For example:
ggplot(data=iris,aes(Sepal.Length, Petal.Length,shape=Species)) +geom_point(size=3) +stat_smooth(se = F)
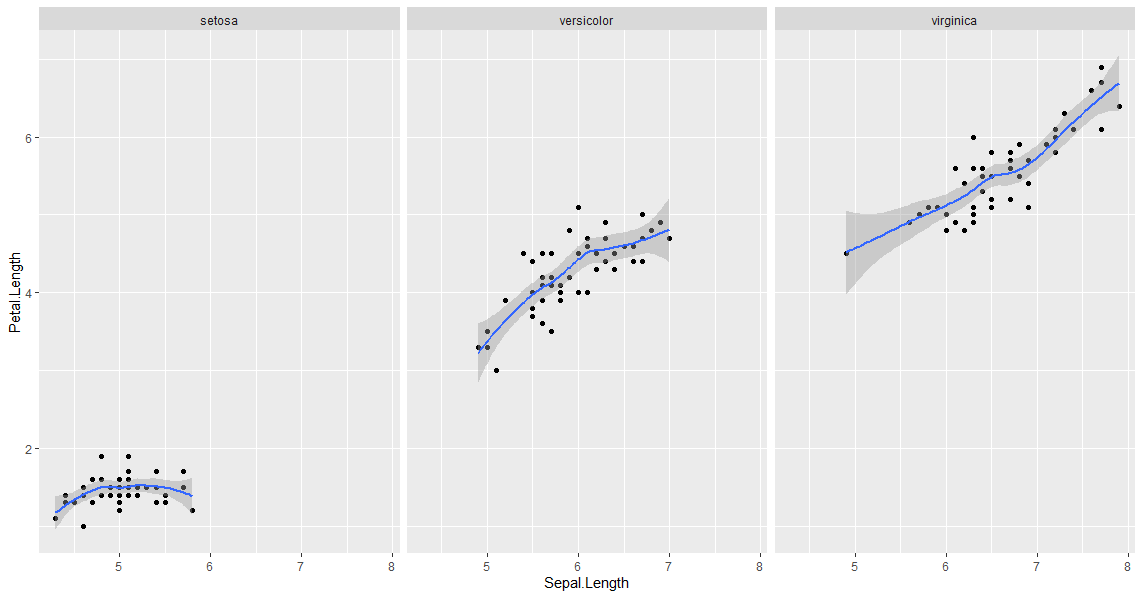
Facets: how to draw several graphics in the same container.
We can draw each species of the iris dataset on a different graph. When there is a lot of information in a single graph (many points, etc.) useful for comparing between levels of a factor, separate for example, between species.
Let's see what happens if we write:
ggplot(data=iris,aes(Sepal.Length, Petal.Length)) +geom_point() +stat_smooth() +facet_wrap(~ Species) # When specifying ~ Species as the value of facet_wrap, each species is represented in a graph.
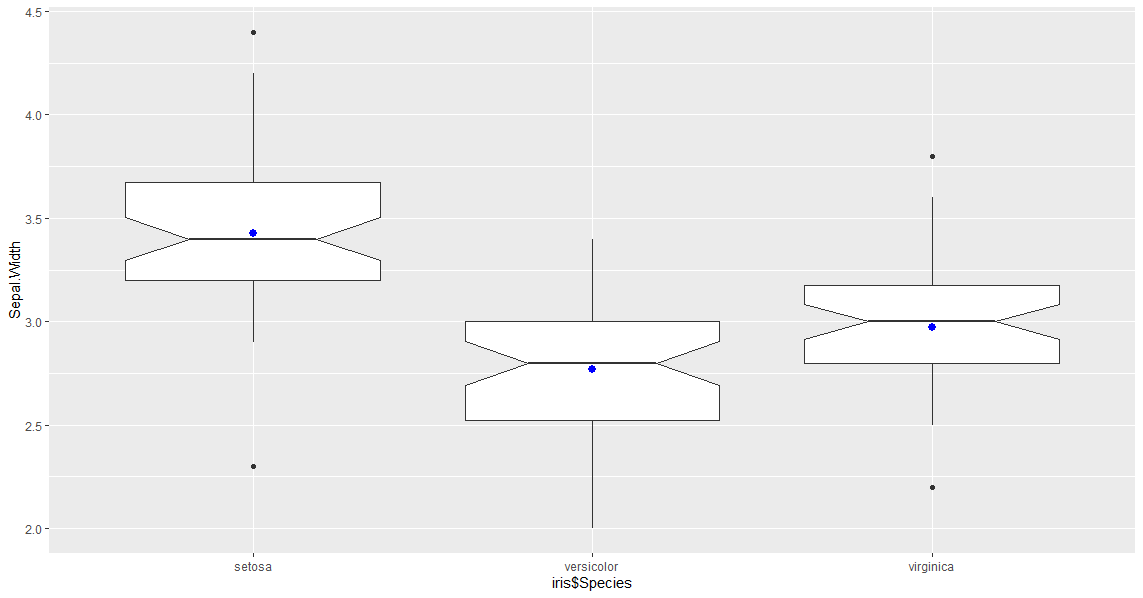
To see more information about dispersion from the mean, we wrote:
ggplot(data=iris,aes(Species, Sepal.Width)) +geom_boxplot(notch = TRUE) +stat_summary(fun=mean, geom=”point”, shape=20,size=4, color=”blue”)
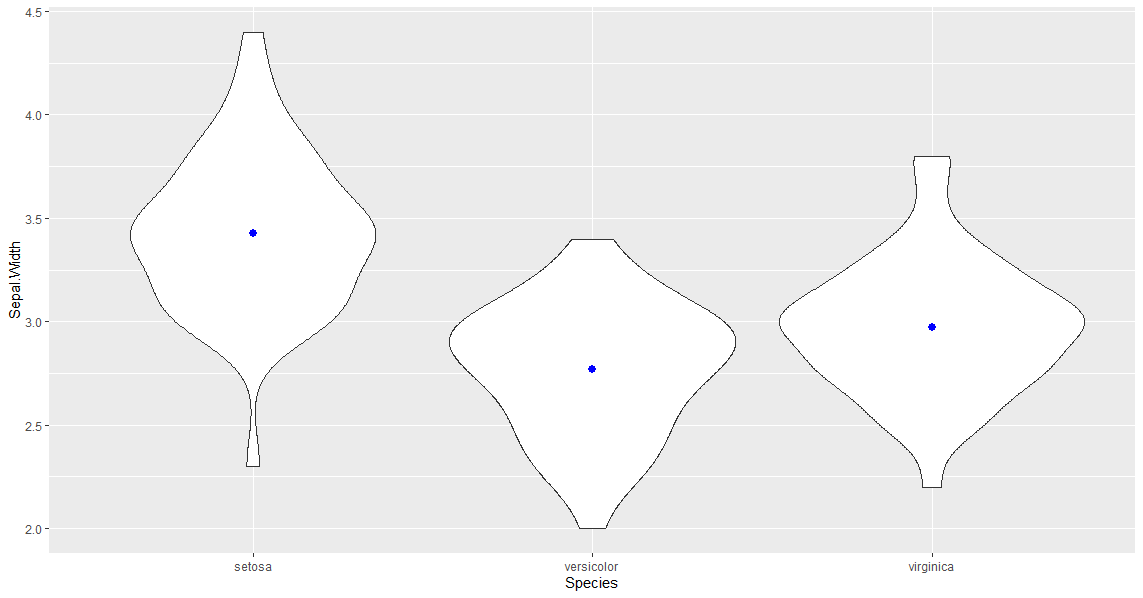
We can also make a violin type diagram:
ggplot(data=iris,aes(Species, Sepal.Width)) +geom_violin() +stat_summary(fun=mean, geom=”point”, shape=20,size=4, color=”blue”)
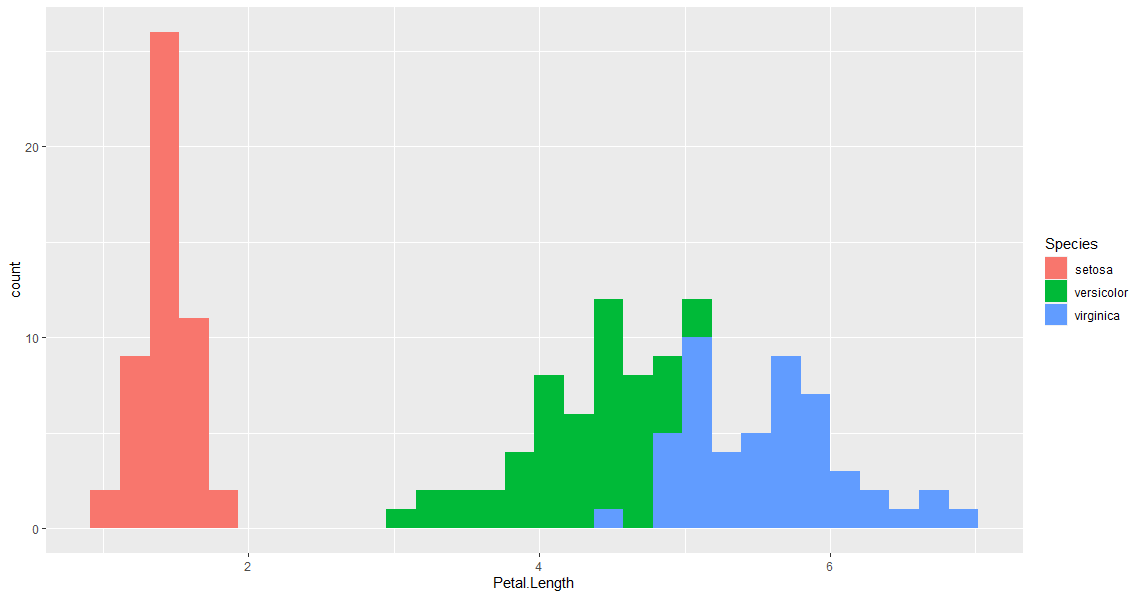
Let's see now how to create a histogram with ggplot2.
If we want a histogram of the length of the petal by species:
ggplot(data=iris,aes(Petal.Length,fill=Species)) +geom_histogram()
We can also create density diagrams.
ggplot(data=iris,aes(Petal.Length,fill=Species)) +geom_density(alpha=0.7)

How can you see the syntax of ggplot is like this: ggplot(data=(dataset, aes(variable, fill=grouping9 +geom (chart type) + stat_summary(added to chart and formats) + facet_wrap(grouping for multiple graphics))